
Assignment #10: Parametric Equations
by
Laura Singletary
Assignment #10: Parametric Equations
by
Laura Singletary
What is a parametric equation? A typical definition of a parametric equation is as follows: Parametric equations are a set of equations that express a set of quantities as explicit functions of a number of independent variables, known as "parameters".
Let us investigate and explore some characteristics of parametric equations. We will begin with the following problem:
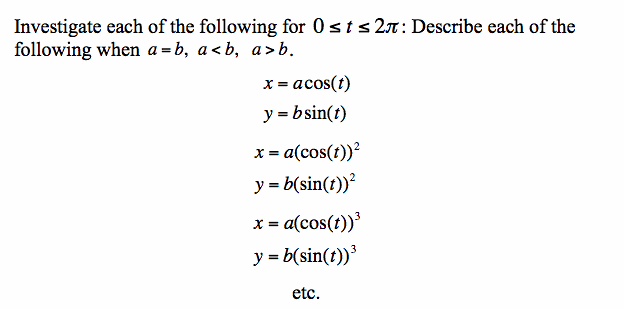
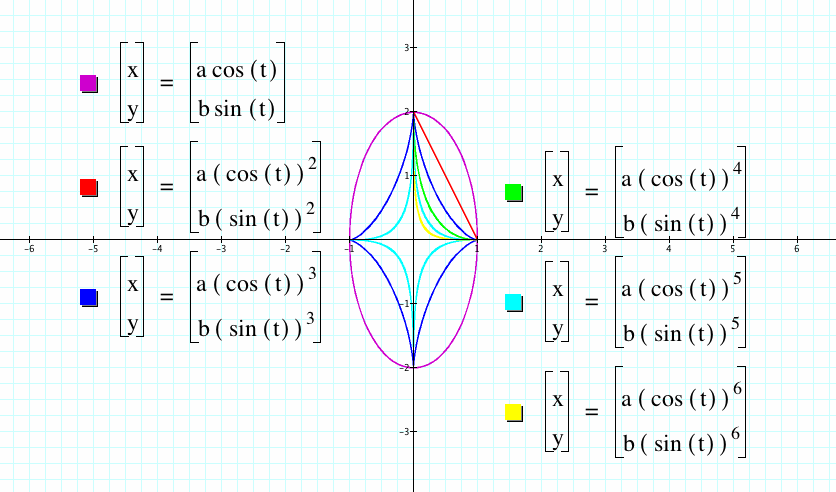
Case 1: Consider the case when a = b and investigate what happens. To begin this exploration, we should consider the most basic case, when a = b = 1. Notice the unique graphs below. Are there any patterns? Can we make any generalizations? What do you think?
The first characteristic that I noticed was the fact that functions with even exponents were restricted to the first quadrant while functions with odd exponents "traveled" through all four quadrants. The functions x = a cos (t) and y = b sin (t) where a = b are a classic way to write the equation of a circle as parametric equations (typically, we are so used to seeing an equation of a circle written with Cartesian coordinates). There was another pattern with odd and even exponents. The equations with even exponents all had common solutions at (1, 0) and (0, 1). Additionally, as the exponent increased the function seemed to increasingly become attracted to the origin. The equations with odd exponents all have solutions at the following: (1, 0), (0, 1), (-1, 0), and (0, -1). Similar the equations with even exponents, the equations with odd exponents gradually are pulled toward the origin as the exponents increase.
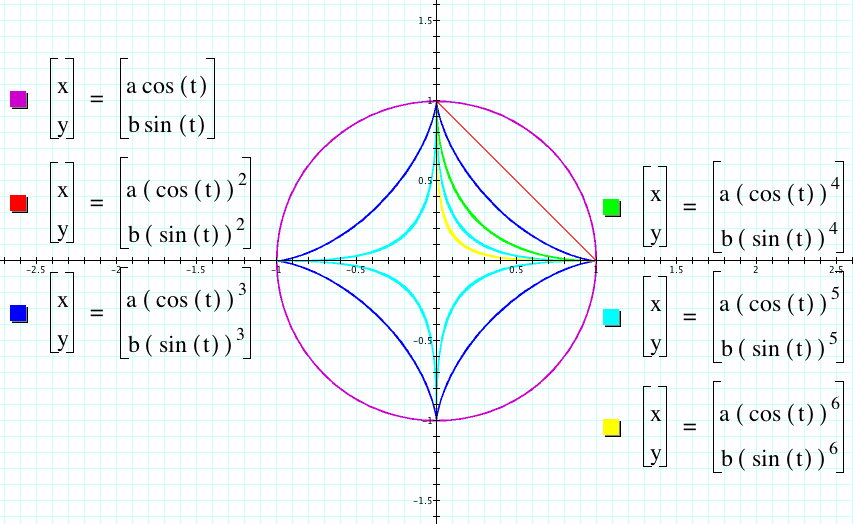
What will happen if we change the value that a and b are equal to on the graph? Let us explore some additional values, for example, when a = b = 0.5.
Notice, the graph looks similar to the previous graph with one notable exception. The even functions now have solutions at (0.5, 0) and (0, 0.5), and the odd fucntions have solutions at (0.5, 0), (0.5, 0), (-0.5, 0), and (0, -0.5).
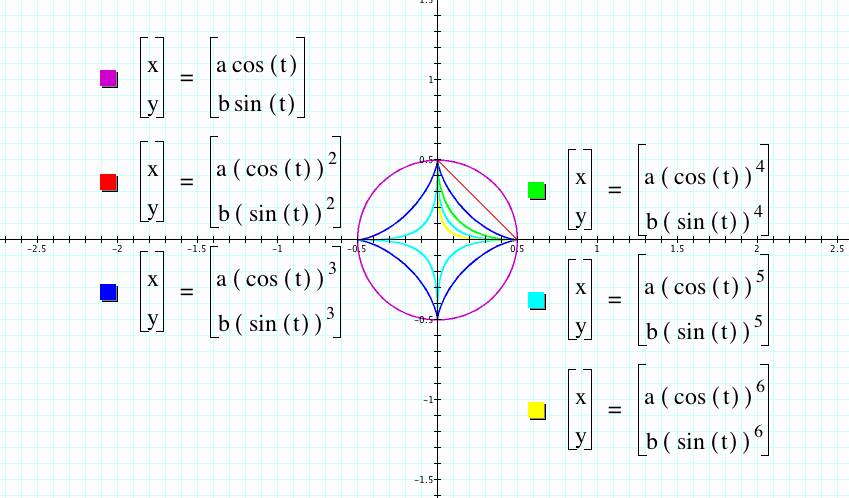
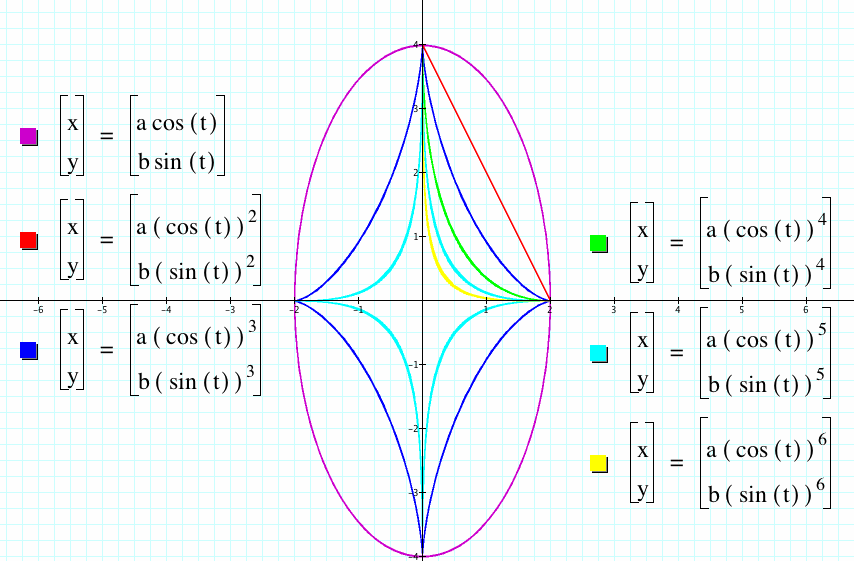
Can you guess what will happen when a = b = 3?
What do you think is happening? What effect do a and b have on the parametric equations? Does it seem like a and b act as if they were the "radius" of the function? Let us consider the other cases before we state our conjectures.
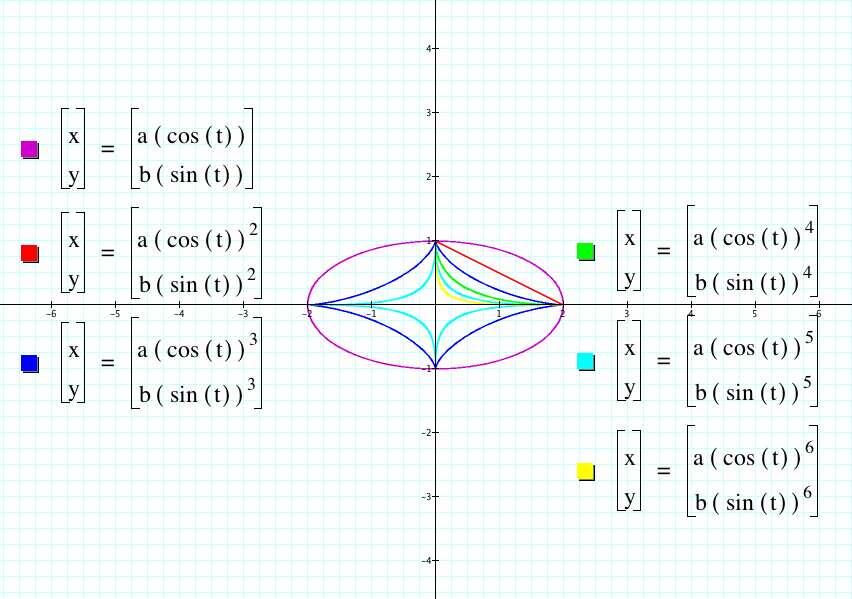
Case 2: Let us consider the case when a < b and investigate what happens. To begin, let us consider what happens when a = 1 and b =2.
While the graph seems similar to the graphs explored for Case 1, there is an obvious difference. The shape of the graph is elongated. We are exploring the case where a<b, and we notice that the b-value is associated with the equation for y. Therefore, it should make sense that if the coefficient for the equation for y is greater, it would have a greater length in the vertical direction. It is also useful to notice that the parametric equations with even exponenets have integral solutions at (1, 0) and (0, 2). Additionally, the parametric equations with odd exponents have integral solutions at (1, 0), (0, 2), (-1, 0), and (0,-2).
Let us consider another example for Case 2, graph the equations when a = 2 and b = 4.
Once again, we see similar things happening. Since b=4, the maximum y-value is 4 and the minimum y-value is -4. Since a = 2, the maximum x-value is 2 and the minimum x-value is -2. While, the pattern is becoming relatively obvious, let us consider the third case.
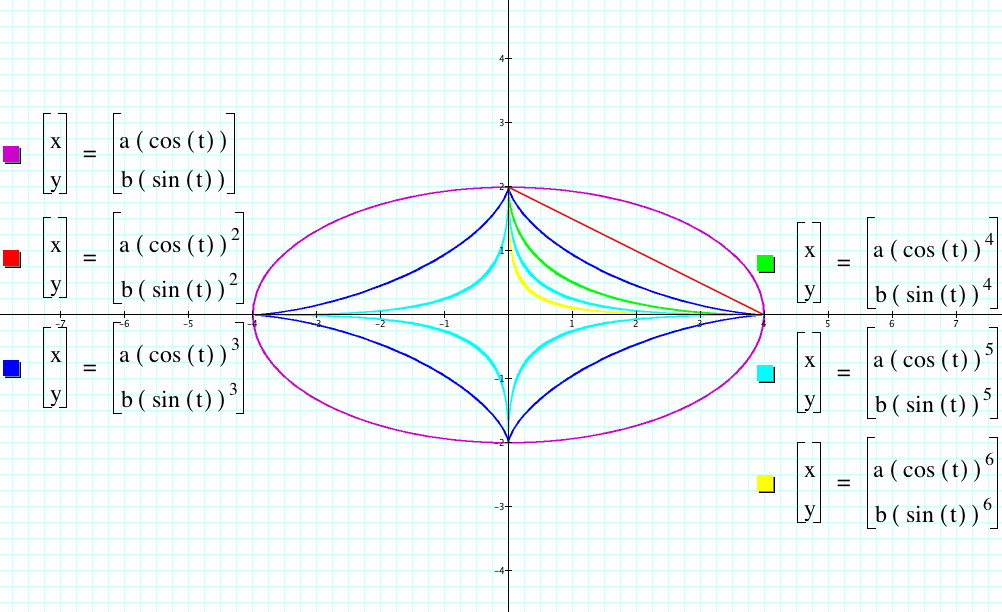
Case 3: Let us consider the case when a > b. To begin this portion of the investigation, let a = 2 and b = 1.
As one might expect, similar things continue to happen. Since a=2 and corresponds to the horizontal value, we see a maximum x-value of 2 and a minimum x-value of -2. As b= 1 and relates to the vertical value, we have a graph that has a maximum y-value at 1 and a minimum value at -1. Continually, the parametric equations with even exponents remain in the first quadrant while the parametric equations with odd exponenets "complete the circuit" and exist in all four quadrants. Lastly, as the exponents increase so does the pull of the graph towards the origin.
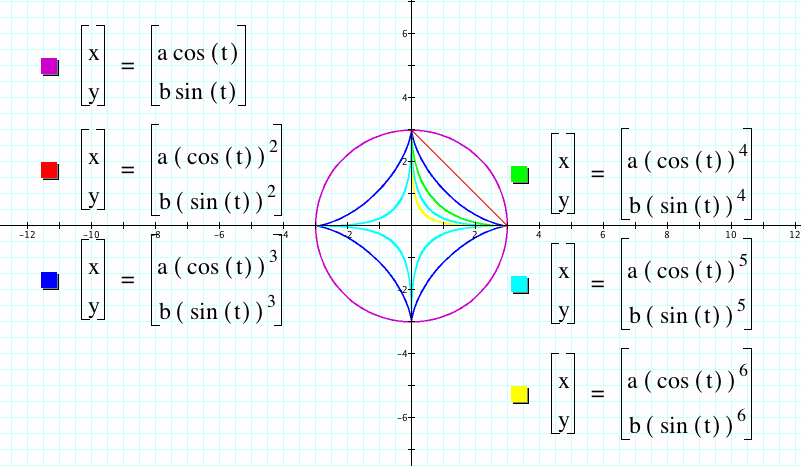
Let us consider one final graph. Consider when a = 4 and b =2. Can you guess what will happen?
True to our expectations, similar things happened as before. This time we have maximum x-values at 4 and a minimum value at -4. We have a maximum y-value of 2 and minimum y-value of -2. These values correspond with our values for a and b.
Consider what we know and trigonometry to determine how we may alter the values for a or b in order to move the graph into other quadrants when the exponents are odd. Explore your ideas here with graphing calcultator.